
Introduction
Besides entertaining us with spectacular stories, science fiction also has the ability to stimulate our imagination and, in a certain way, predict how the technological landscape will be shaped in the future. For example, in the context of data analytics, films like “Minority Report” allow us to envision what it would be like to visualize and analyze data through immersive experiences, using devices that augment reality and enable interaction with metaphysical objects (such as holograms).
Today, this fantasy is becoming a reality with the advent of Extended Reality (XR) headsets such as Microsoft HoloLens, Google Glass, Oculus, and Magic Leap. These devices allow users to blend the real world with virtual elements like holograms, virtual dashboards, and avatars, interacting with them as if they were real objects.
However, despite these advancements, companies still lack truly immersive experiences when analyzing data. Modern Augmented Business Intelligence (ABI) platforms are transforming how business users explore and gain insights from data through the incorporation of exponential technologies. Yet, most use cases still rely on single-touch and click-based interactions.
Aware of their potential to be the first point of contact between business users and data, ABI platforms are pushing beyond these limitations, leading to the emergence of Meta BI.
What is Meta BI
Meta BI is the fusion of Augmented BI with Extended Reality technologies, designed to overcome the limitations of traditional BI, which is typically constrained to 2D visualizations and click-based devices.
Meta BI can be seen as an evolutionary path of Augmented BI, aiming to deliver an immersive experience on data by leveraging a technological ecosystem that provides enhanced user interaction and deeper data immersion to enrich the process of discovering insights.
As the Metaverse evolves, so does Meta BI, following two primary directions:
- Data Immersion: Enhancing how users navigate dashboards and visualize data objects.
- User Interaction: Improving how individuals or groups interact with tech devices.
The main benefits of adopting Meta BI over traditional solutions include:
- Multi-dimensional Visualization: The use of 3D technologies to facilitate data navigation and insights discovery.
- BI Beyond the Screen: Enabling access to data anywhere, not just on computer screens.
- Real Experiences: Virtual experiences that closely mimic real-life interactions (through wearable devices, holograms, etc.).
- Data Immersion: Bridging immersive experiences with real-world business data (e.g., augmenting reality with data holograms).
To achieve the highest level of Meta BI, companies should enhance their user experience across two dimensions: Data Immersion and User Interaction, progressing through the six stages of Datwave’s evolutionary framework for Meta BI.
Meta BI Evolution Framework
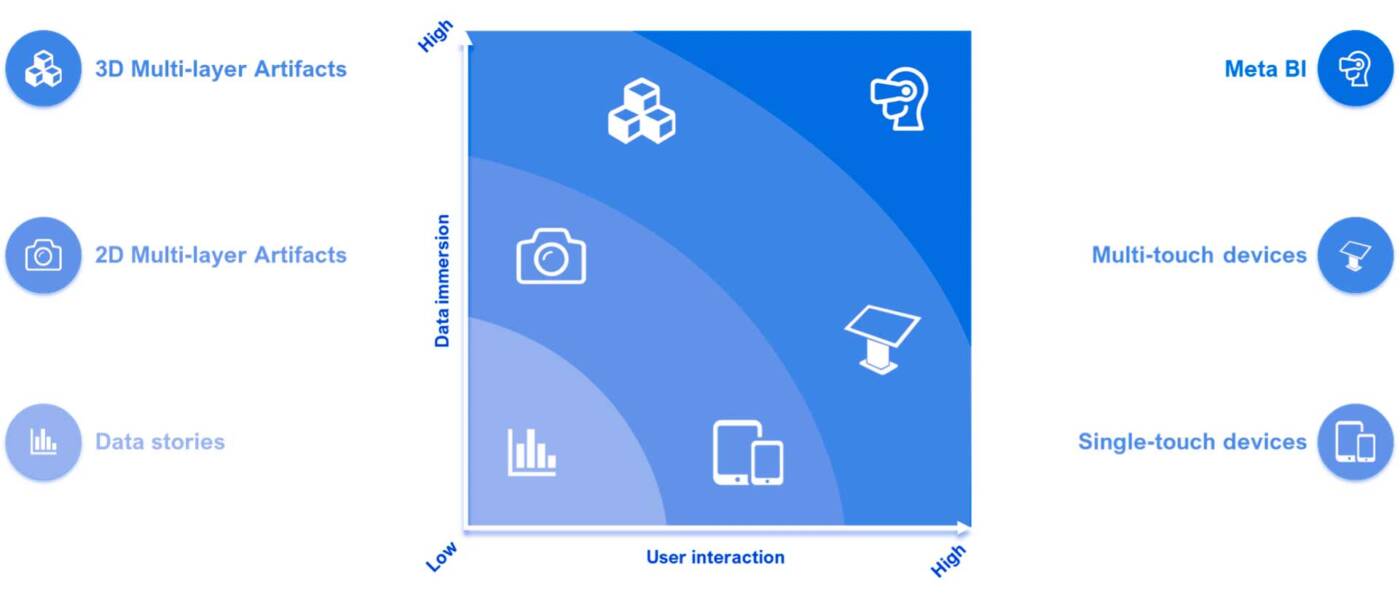
Figure 1 Meta BI Evolution Framework
1. Data Stories:
Storytelling information is a unique way of presenting data that resembles real-life narratives, making dashboards more engaging with a classic look-and-click approach to uncover business insights. Most major BI vendors offer features that enable storytelling from BI data: Qlik Sense with “Storytelling,” Tableau with “Stories,” and Power BI through “Bookmarks” or its recent integration with PowerPoint.
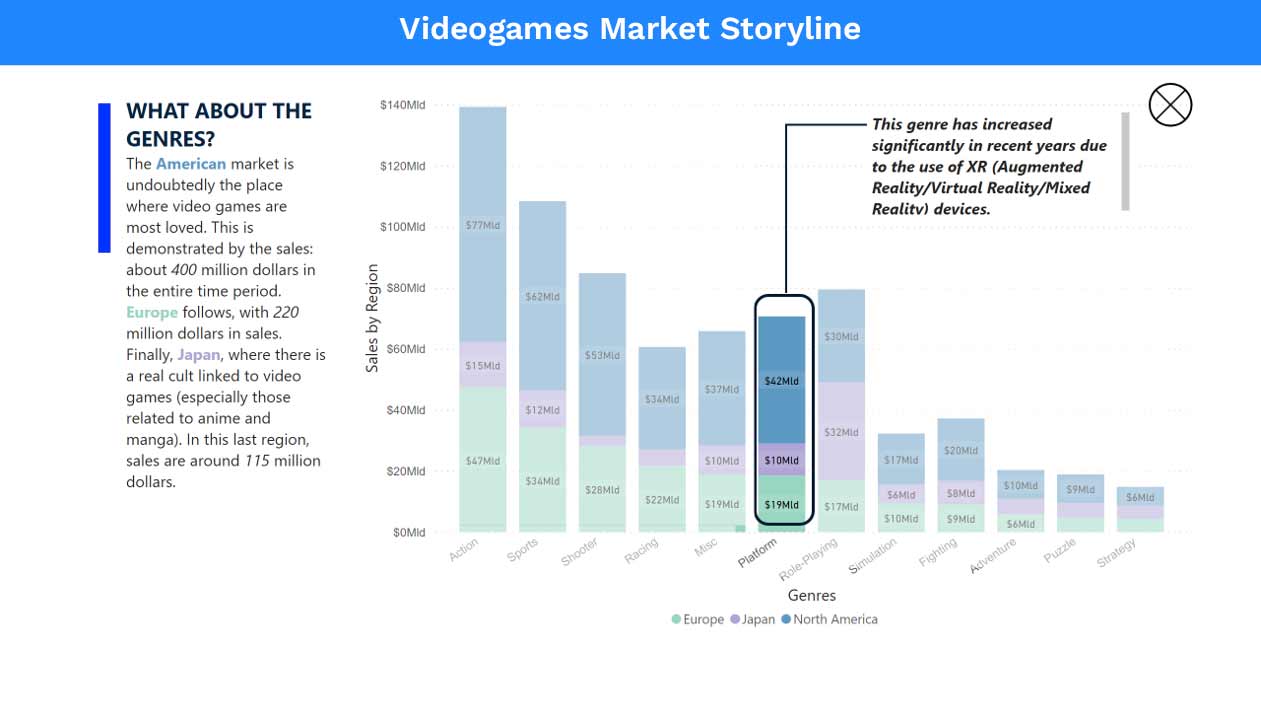
Figure 2: Storytelling with Microsoft Power BI
2. 2D Multi-layer Artifacts:
Representing data through 2D visual objects and multi-layer maps enhances readability and spatial exploration. ABI platforms like Microsoft Power BI allow custom visuals with tools like Synoptic Panel or Visio for interactive mapping. Multi-layer mapping services are also available from specialized vendors like MapIT and ArcGIS, or directly from BI vendors like Google and Qlik.
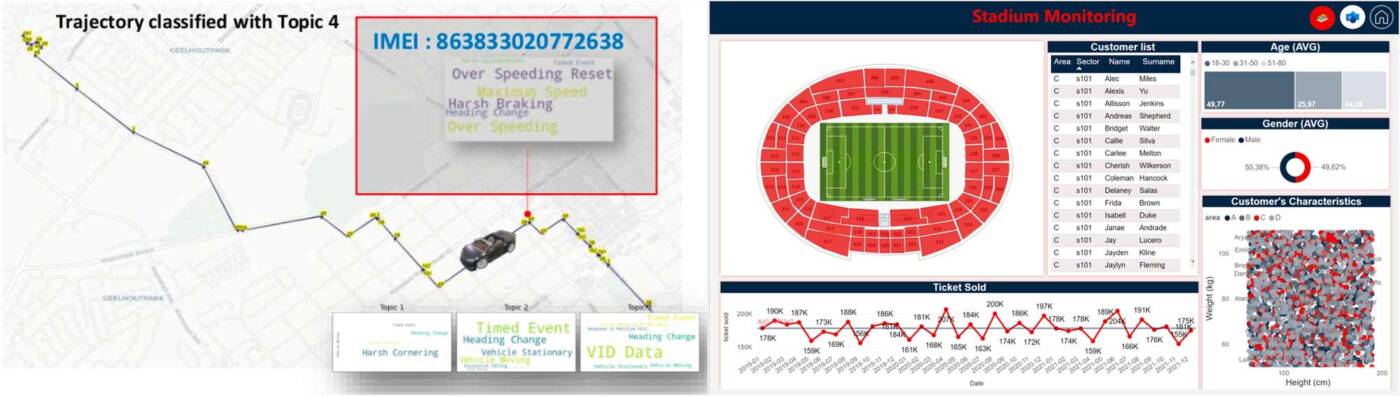
Figure 3: Custom Map for Mobility Monitoring made by MapIT | Figure 4: Stadium Monitoring in MS Power BI with Visio
3. 3D Multi-layer Artifacts:
Using 3D objects for data navigation introduces freedom by breaking into the third dimension with advanced computer graphics. Solutions include custom dashboards from KeyBiz leveraging their IoT platform, Metamorphosis, or 3D visualization plugins like Vcads, Tracer, and Mapbox.
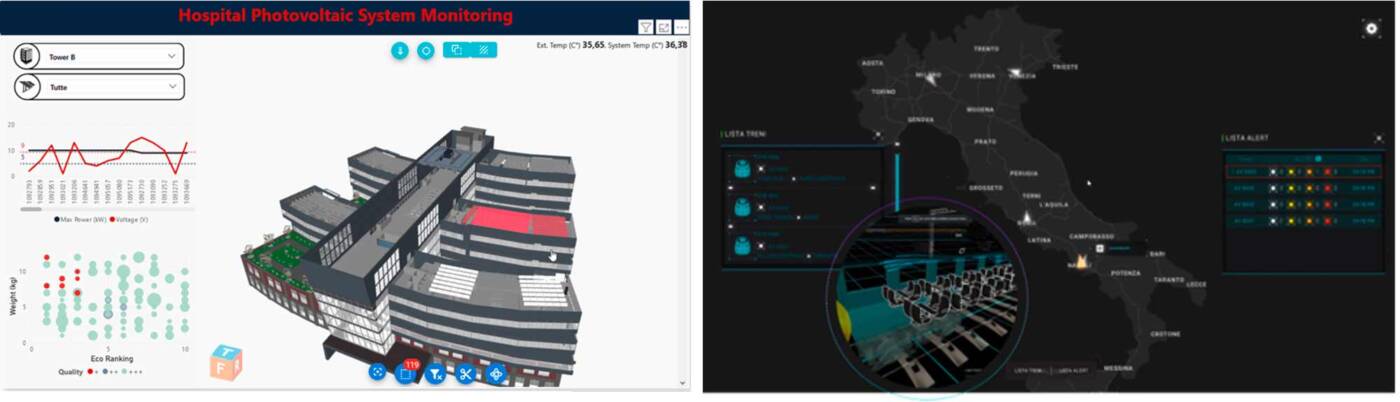
Figure 5: Hospital Photovoltaic Monitoring System with Vcad | Figure 6: Train Monitoring with Metamorphosis (KeyBiz)
4. Single-touch Devices:
Major BI tools such as Google Looker offer mobile apps for data navigation on the go. Apps like Power BI Mobile and Mobile Analytics from Qlik Sense allow users to set alerts and notifications, actively supporting end-users with accessible BI features.
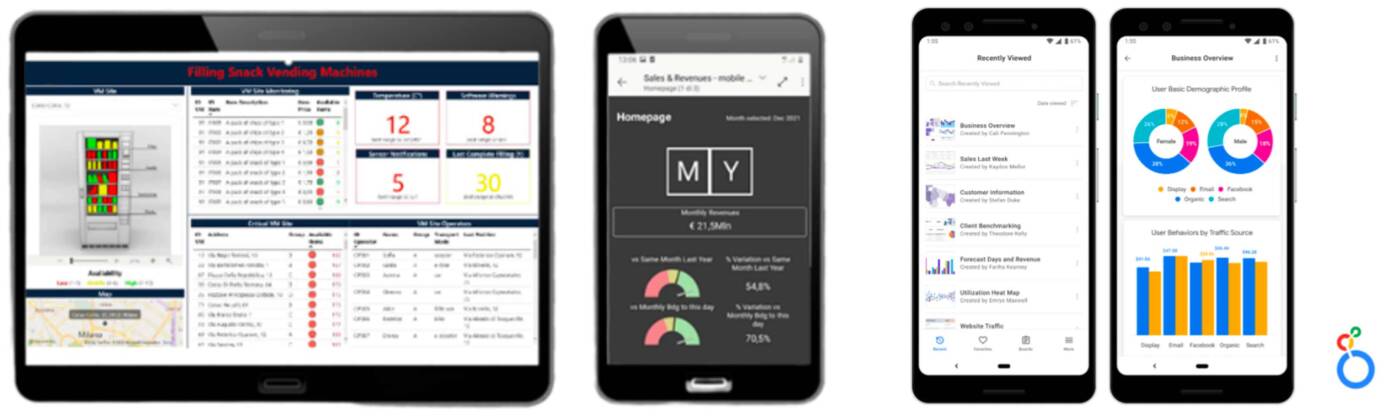
Figure 7: Multi-devices Power BI Reporting | Figure 8: Mobile App Google Looker
5. Multi-touch Devices:
Interactive dashboards accessible on multi-touch devices, like Surface Hub and Vibe Smartboard, enable collaborative insights discovery. Vendors like KeyBiz also provide integration with multi-touch tables using their Metamorphosis IoT platform.
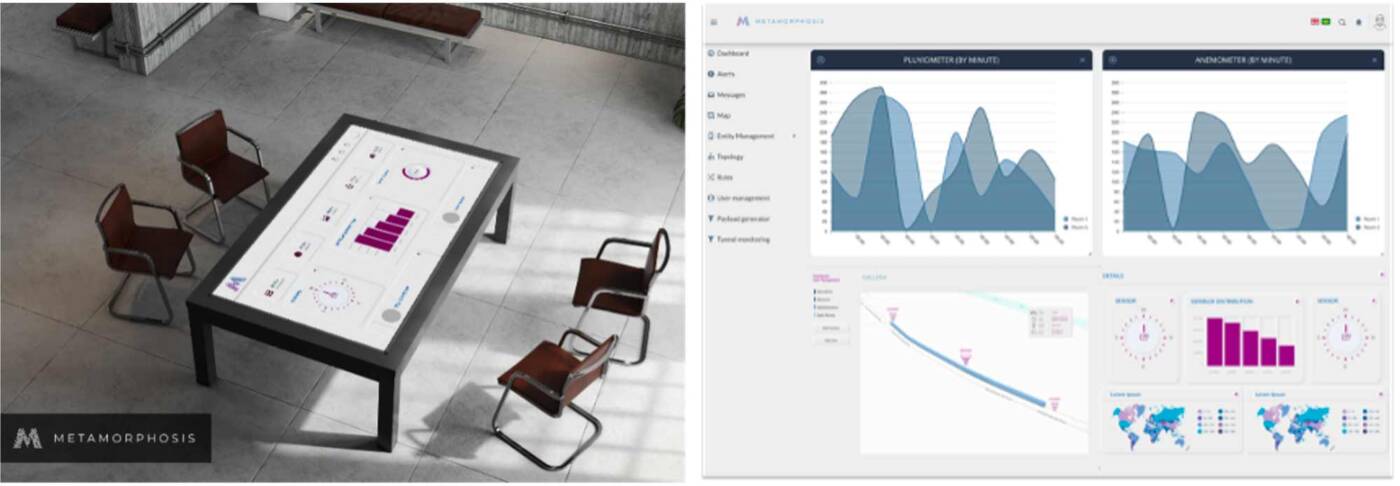
Figure 9: Metamorphosis Reporting on Multi-touch Table
6. Meta BI:
The most advanced stage of Meta BI integrates with Extended Reality (XR). Platforms like Google Looker with “LookVR” and Power BI for Hololens 2 allow users to interact with data and reality simultaneously, opening opportunities for innovative use cases such as remote assistance, plant monitoring, and holographic simulations.

Figure 10: Google Looker VR Reporting based on Rift device | Figure 11: Hologram and Power BI Charts on HoloLens 2
Where to start?
As the Metaverse shapes the future of the internet, BI is evolving into Meta BI to create immersive data experiences. While many companies are unaware of the potential of Meta BI solutions, those in capital-intensive industries like Manufacturing, Energy, Buildings, and Transportation are pioneering these innovations.
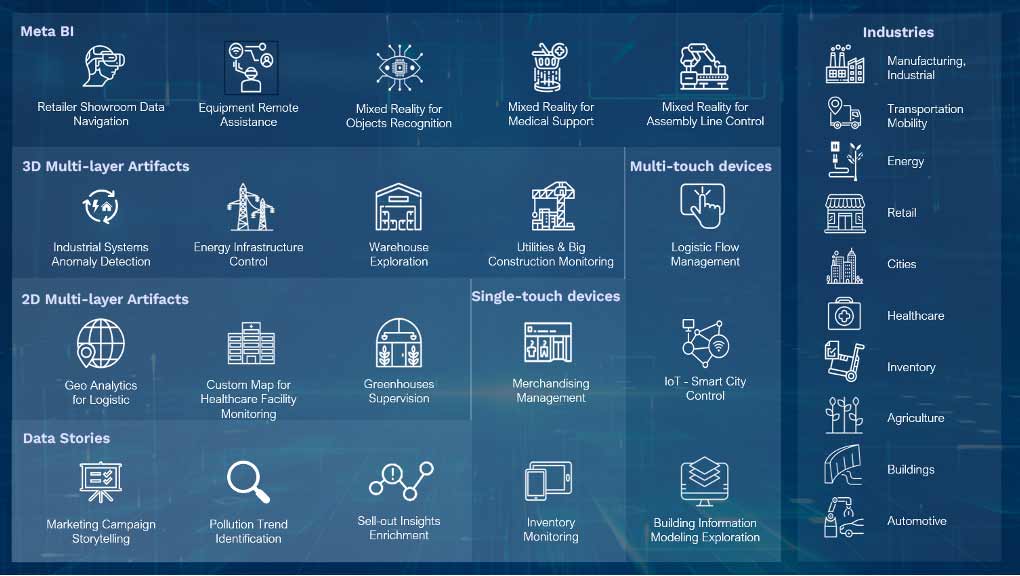
Figure 12: Meta BI Use Cases and Industries
Datwave can assist companies in adopting Meta technologies and preparing for the Metaverse. Our end-to-end approach covers the entire Meta BI project lifecycle, from designing specific use cases to developing and deploying Meta BI solutions, fostering a data-driven and meta-driven culture.
Contact us to learn more about our comprehensive offering or to speak with one of our experts.
Disclaimer
In this article, some products/vendors have been mentioned as examples to illustrate some advanced functionalities. Datwave has partnerships with many of these vendors but, aligned with our vendor independence strategy, we maintain as technology agnostic and, therefore, we are able to recommend the best solution depending on the client need, leveraging on a group of experts certified in most of these technologies.
References
- https://www.wired.com/story/what-is-the-metaverse/
- Mystakidis, S. Metaverse. Encyclopedia 2022, 2, 486–497. https://doi.org/10.3390/encyclopedia2010031
- https://icg.citi.com/icghome/what-we-think/citigps/insights/metaverse-and-money_20220330
- https://www.researchandmarkets.com/reports/5239768/global-augmented-reality-and-virtual-reality
- https://www.nytimes.com/2021/10/28/technology/facebook-meta-name-change.html#:~:text=The%20social%20network%2C%20under
%20fire,digital%20frontier%20called%20the%20metaverse.&text=As%20a%20subscriber%2C%20you%20have,can%20read%20what%20you%20share - https://www.nytimes.com/2022/01/20/podcasts/the-daily/metaverse-microsoft-activision-blizzard.html
- https://www.forbes.com/sites/bernardmarr/2022/02/21/the-top-10-tech-trends-in-2022-everyone-must-be-ready-for-now/?sh=2fd0e2c7827d
- https://www.gartner.com/en/information-technology/insights/top-technology-trends
- Augmented Business Intelligence: the massive adoption of edge data technologies. Bueno V. (2021)
- https://powerbi.microsoft.com/en-us/blog/tell-a-story-with-your-data-announcing-the-all-new-power-bi-integration-for-powerpoint/
- https://www.researchandmarkets.com/reports/5239768/global-augmented-reality-and-virtual-reality
- https://www.fortunebusinessinsights.com/business-intelligence-bi-market-103742
- https://store.steampowered.com/app/595490/LookVR/
